At-A-Glance Program Director Survey
The At-A-Glance Program Director Survey* uses data visualization software and draws from the same data source as the NRMP’s publications of the Results of the Program Director Survey. This resource provides a snapshot of program director responses to the survey questionnaire.
*Best viewed on a desktop computer or tablet.
How to Interpret the Data
The tool consists of various filterable views of criteria that program directors use to make interview and ranking decisions.
Initial Views and Selecting Views
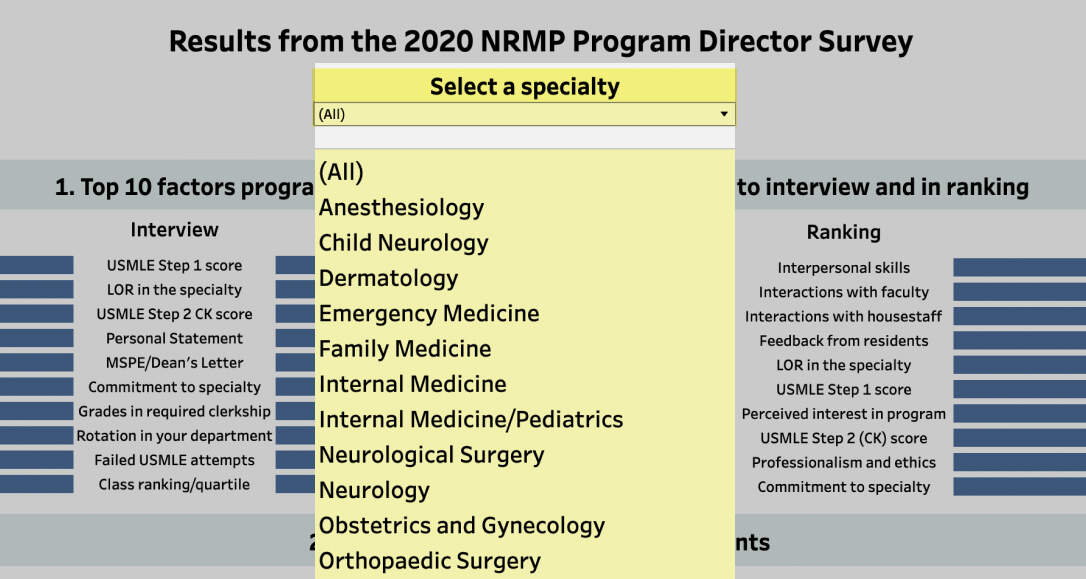
The initial view shows results for programs in all specialties. To narrow the results to a single specialty, select the specialty from the drop-down box:
The drop-down box allows for quick, seamless comparison of data across specialties.
A pop-up window “tooltip” provides basic information and is accessible any time the computer mouse hovers over a data point.

VIEWS CONSIST OF
Top 10 Factors
The factors identified most by program directors in the specialty to select applicants for interview and ranking (and the scaled importance from 1=“not important at all” to 5=“very important” of that factor).
USMLE and COMLEX Score Requirements
The factors identified most by program directors in the specialty to select applicants for interview and ranking (and the scaled importance from 1=“not important at all” to 5=“very important” of that factor).
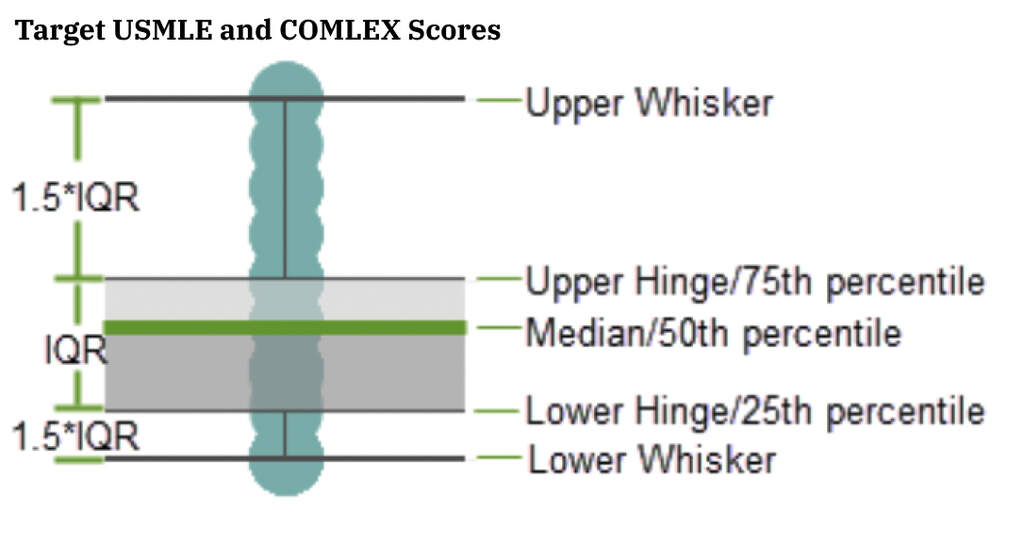
Target USMLE and COMLEX Scores
For programs that required target scores, USMLE Step 1 and Step 2 CK and COMLEX-USA Level 1 and Level 2-CE examination data are presented in box-and-whisker plots. For each exam, two plots are displayed: (1) scores below which programs generally do not grant interviews (left plot in blue) and (2) scores above which programs almost always grant interviews (right plot in green). The middle section of each plot between the upper and lower “hinges” (the interquartile range, or IQR) is called the “box,” and the lines extending parallel from the boxes are known as the “whiskers.” Whiskers are 1.5 times the IQR away from the “hinges.” Data outside upper and lower whiskers are outliers.
More detailed explanations about the box-and-whisker plot can be found online.
Note: COMLEX-USA charts are blank for specialties that have not matched a sufficient number of osteopathic applicants to provide reliable data.

Exam Failure
The percentages of program directors in the specialty who “Never”, “Seldom”, or “Often” considered applicants who failed an examination on the first attempt, aggregated by applicant type.
Positions, Applications, Interviews, and Ranks
The mean numbers of positions in the Match, applications reviewed, interview invitations sent, applicants interviewed, and applicants ranked by programs in the specialty.
Interview Schedules
The percentages of interview invitations sent and interviews conducted monthly by program directors in the specialty.
Resident Success
A list of factors rated by program directors in the specialty in determining resident success in the program. Average rating is on a scale of 1=”not important at all” to 5=”very important”.
DATA CONSIDERATIONS
- Transitional Year programs and programs in 22 specialties with 10 or more responses from program directors are included.
- The overall response rate to the 2020 survey was 18.0 percent. Specialty-specific response rates can be found in the complete report.
- Not all program directors responded to all questions; accordingly, missing data exist in all sections.